
Unsupervised Gene Clustering of Grape Berries While Ripening
Grape berry development is a dynamic process that involves a complex series of molecular genetic and biochemical changes. In this blog, we will do an unsupervised clustering using expression profile of grapes while ripening.
Dataset
The dataset I am using is from a microarray experiment monitoring 16604 gene expression profile in whole fruit tissues of Cabernet Sauvignon grape berry while ripening over 112 days. You can download the dataset here. This data set contains 16604 rows and 8 columns. Each row contains gene expression profile of one particular gene on 7 specific days(21th, 42th, 49th, 56th, 63th, 84th, and 112th). The first row in the file is the header (geneID/days in time series). The paper that describes the methods and results is can be found here(Deluc2007).
There are several tool boxes to perform clustering, including the open source clustering software Cluster 3.0, which uses a Perl script for clustering that can be found here: http://bonsai.hgc.jp/~mdehoon/software/cluster/software.htm or WEKA, a collection of machine learning algorithms for data mining in Java that can be found here: http://www.cs.waikato.ac.nz/ml/weka/
Unsupervised Clustering Tools
For this exercise we will use the R statistical programming language and Bioconductor. The package “cluster” that we are using here is part of Bioconductor includes several methods for unsupervised clustering. We can use one of the methods agnes, diana and mona to perform hierarchical clustering and the methods pam, clara and fanny, to perform partitioning (non-hierarchical clustering). The reference manual for the package is under cluster.pdf and can be accessed from:
http://cran.r-project.org/web/packages/cluster/index.html
Non-hierarchical Clustering/Partitioning of Genes During Berry Development
We use pam to cluster the Deluc_Grapes_Dataset1, for number of clusters k=5,10,20.
Below is my R script of calling the pam methods:
library("cluster")
raw.data <- read.table("Deluc_Grapes_Dataset1.txt", sep="\t",header= TRUE, skip=1)
head(raw.data)
dim(raw.data)
k<-5
head(raw.data)
pamx<-pam(raw.data[,-1],k)
pamx
summary(pamx)
plot(pamx)
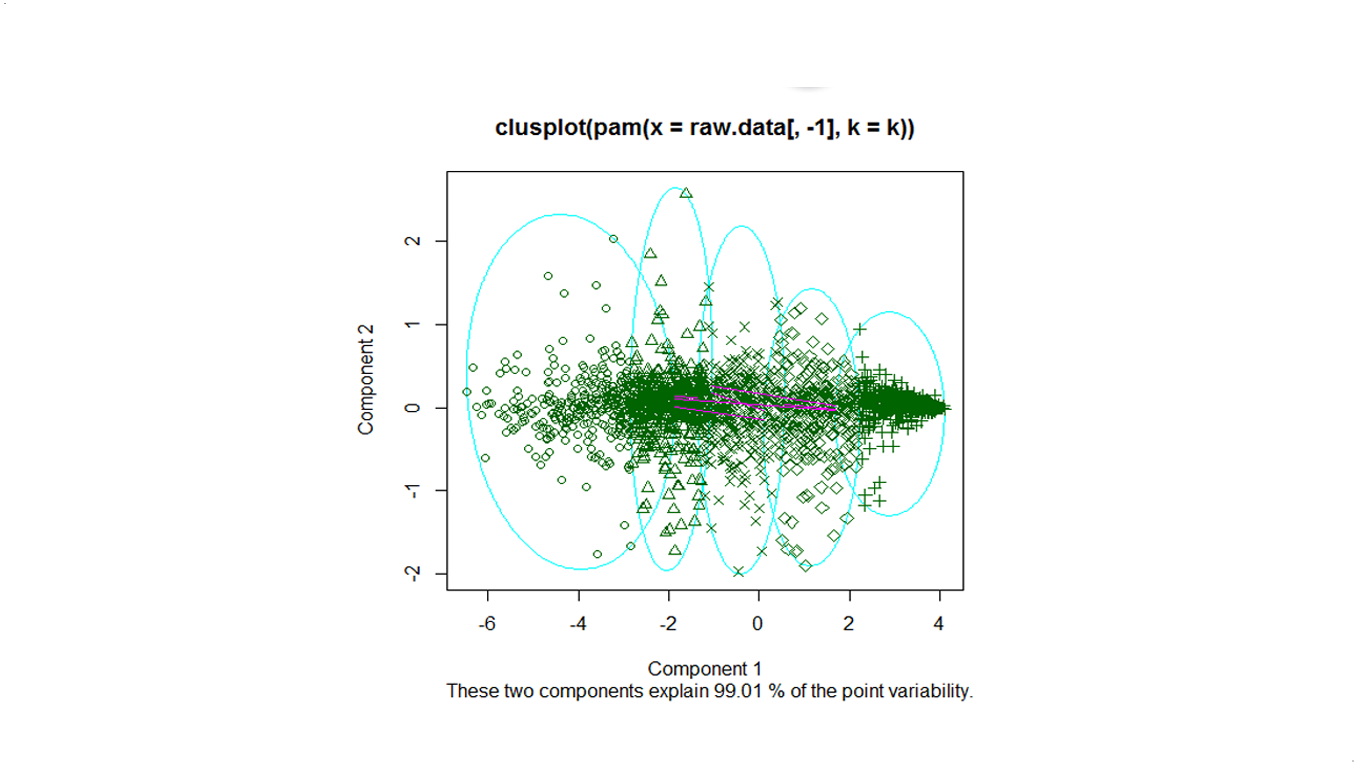
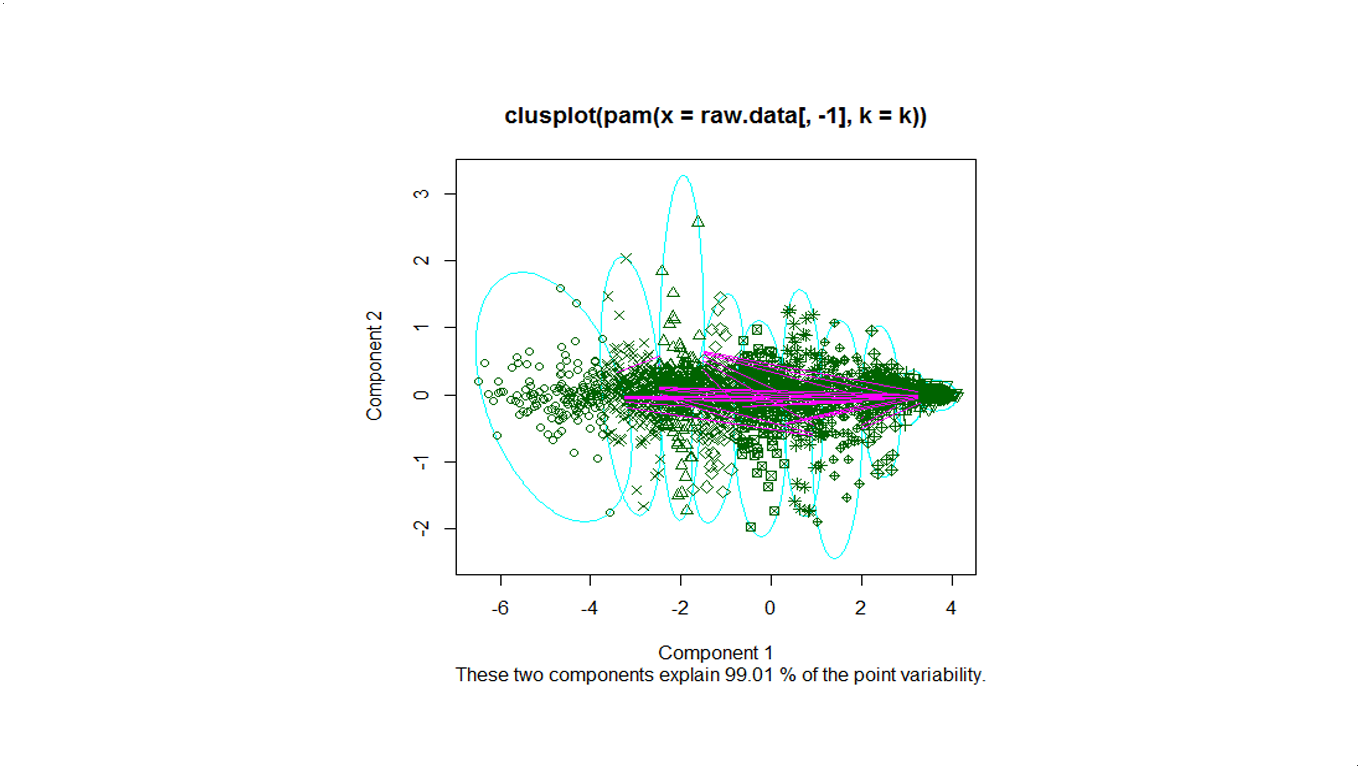
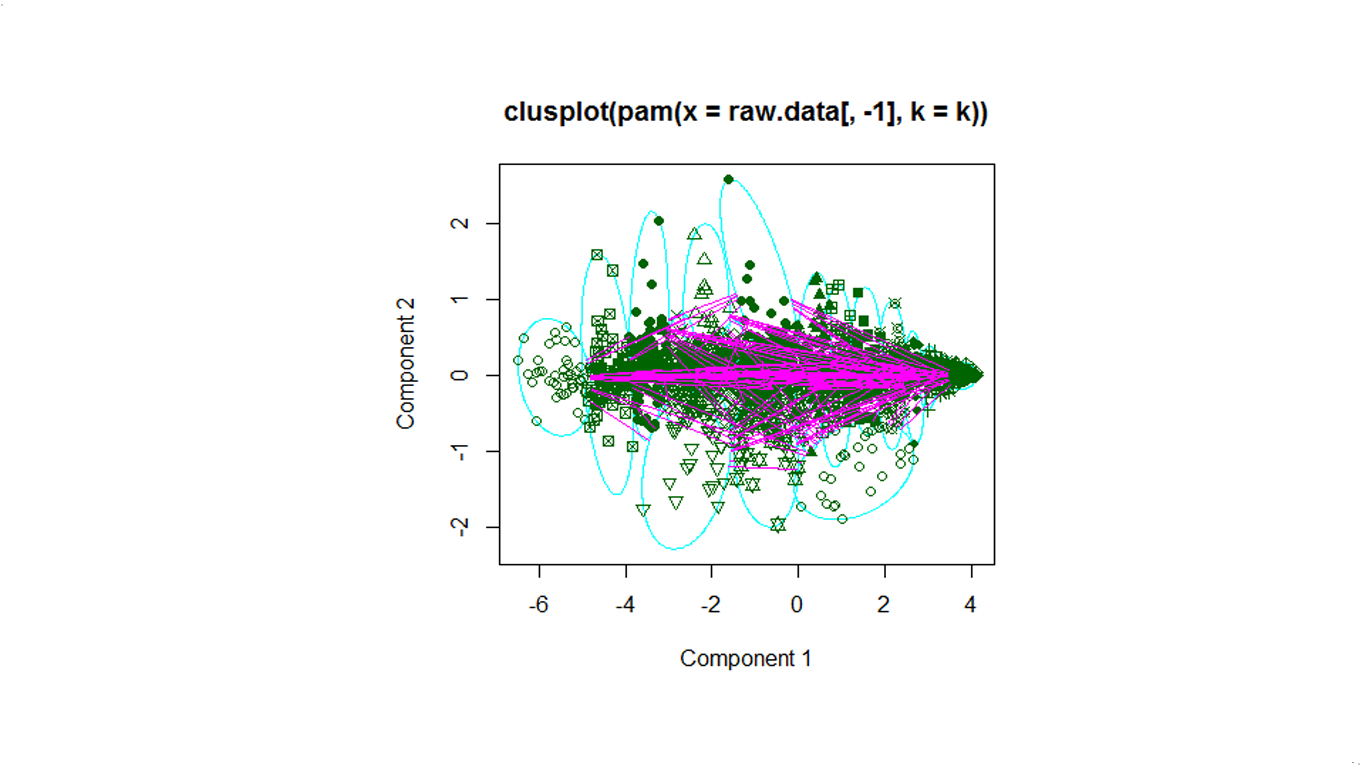
Below is the overview of clustering with a serie of cluster numbers.
k=5
k=10
k=20
Results and Future works
In this link I report (a) the top 3 genes, (b) the cluster center, and (c) the number of genes in the cluster for a pivot study of gene expression profiles during grape ripening. Future works will include hierarchical clustering methods, and use BIC or AIC to calculate the number of clusters that optimize the objective functions.