
Random Forest based Gene Regulatory Network Inference during E.Coli Biofilm Formation
Which genes are dominating when bacteria are trying to form a film? In this blog, I will build a gene regulatory network from E.Coli gene expression data during biofilm formation, using a method based on Random Forests, and perform a functional analysis for that network.
Background
Biofilms are a community of microorganisms attached to a surface by polysaccharides, proteins, and nucleic acids. E. coli biofilm development is a complex process that leads to beautiful structures that are important for disease and for engineering applications. It remains a question that what genes are dominating when bacteria are trying to from a film? $^1$
Datasets
I use a dataset from a microarray experiment of Escherichia coli K-12 strain to investigate biofilm formation in the first 24 hours of the culture. You can download the dataset here. This file contains 4633 rows and 10 columns. Each row include the gene ID, identifier, and the microarray data of one gene after 4, 7, 15, and 24 hours of incubation under two different conditions. The two conditions are under biofilm and in suspension as a control. The first two rows are headers are gene ID, experimental conditions and hours. These signal pathways of these 4631 genes forms a genetic regulatory network. We are going to infer the top regulating genes in this network that drive the biofilm formation process based on these data.
The paper that describes this experiment is the following: Domka J, Lee J, Bansal T, Wood TK. Temporal gene-expression in Escherichia coli K-12 biofilms. Environ Microbiol. 2007 Feb;9(2):332-46. And you can download it from: http://www.ncbi.nlm.nih.gov/pubmed/17222132
Random Forests
Here I provide a step-by-step description of Random Forests, the basic machine learning method that powers the GENIE3 method. The paper that describes how GENIE3 work has been published in PLoS One in 2010 and can be viewed here:
http://journals.plos.org/plosone/article?id=10.1371/journal.pone.0012776
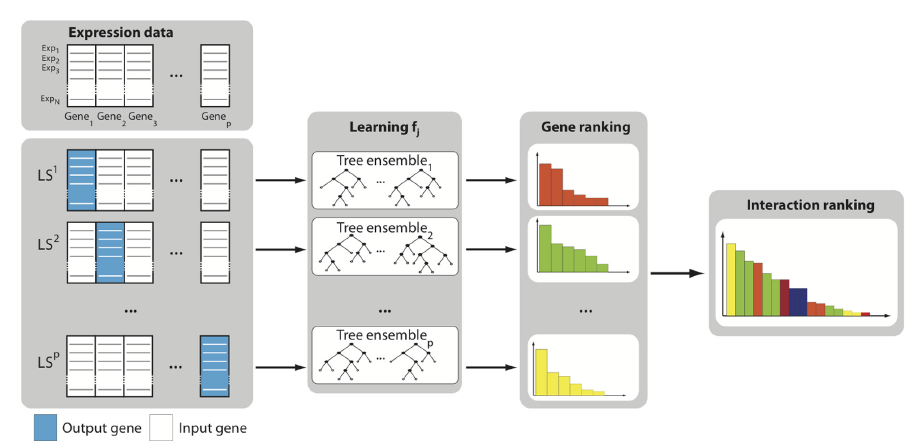
This method makes the assumption that the expression of each gene in a given condition is a function of the expression of the other genes in the network (plus some random noise). Say we have $p$ genes in the network:
-
For $j$ =1 to $p$,
a. Generate the learning sample of input-output pairs for gene $j$, where the vector of expression of all genes except $j$ is the input denoted by $X$, and the expression of gene $j$ is the output denoted by $Y$. Construct a training set $X$ = $x_1, …, x_n$ with responses $Y$ = $y_1, …, y_n$.
b. Build a Random Forests ensemble.
- Sample with replacement from the training set (B times); call these $X_b$, $Y_b$.
- Train a decision or regression tree fb on $X_b$, $Y_b$.
- At each candidate split in the learning process, a random subset of the features/attributes are selected. This process is sometimes called “feature bagging”. In this case, different subsets of genes are selected.
- Different algorithms use different metrics as criteria to split at each nodes, such as, Gini Impurity and information gain. Below is one example of training decision trees based on information gain: http://christianherta.de/lehre/dataScience/machineLearning/decision-trees.php
- Generally, after training, predictions for unseen samples $x’$ can be made by averaging the predictions from all the individual regression trees on $x’$, or by taking the majority vote in the case of decision trees.
c. In this case, for a single tree, the overall importance of one variable is then computed by summing the importance measure of all tree nodes where this variable is used to split.
-
Aggregate the $p$ individual gene rankings to get a global ranking of all regulatory links.
Gene Regulatory Network Inference using GENIE3
Use the tool GENIE3, which can be downloaded from http://homepages.inf.ed.ac.uk/vhuynht/software.html
My code Implementation:
import numpy as np
from GENIE3 import *
import pandas as pd
df=pd.read_csv('GDS2768.csv',sep='\t',header=1)

gene_names_Ecoli = list(df["ID_REF"])
df1=df.ix[0:,2:]
data_Ecoli=np.array(df1.transpose().as_matrix().tolist())
tree_method = 'RF'
(VIM4, MSE_overall, treeEstimators) = genie3(data_Ecoli,tree_method=tree_method,compute_MSE=True)
get_link_list(VIM4, gene_names=gene_names_Ecoli,file_name='ranking_ID_REF.txt')
Here you can download my report the top 100 interactions (i.e. source, target, type of edge) their score and the statistical significance of the score.
Fuzzy Clustering of Regulating Genes
Now we have the top 100 interactions. The next question is, what are the functions of these top regulating genes?
You are recommended to use the fuzzy clustering tool, named DAVID from http://david.abcc.ncifcrf.gov/ to find all functional categories of genes that relate to 100 interactions above.
DAVID Functional Annotation Clustering uses a fuzzy clustering concept as functional classification by measuring relationships among the annotation terms on the basis of the degree of their coassociation with genes within the user’s list to cluster somewhat heterogeneous, yet highly similar annotation into functional annotation groups.
Fuzzy clustering (also referred to as soft clustering) is a form of clustering in which each data point can belong to more than one cluster. Clustering or cluster analysis involves assigning data points to clusters (also called buckets, bins, or classes), or homogeneous classes, such that items in the same class or cluster are as similar as possible, while items belonging to different classes are as dissimilar as possible. Clusters are identified via similarity measures. These similarity measures include distance, connectivity, and intensity. DAVID statistical guarantees include Fold enrichment, percentage, Classification stringency, Enrichment score, P-value, and Benjamini.
Results (categories and counts):
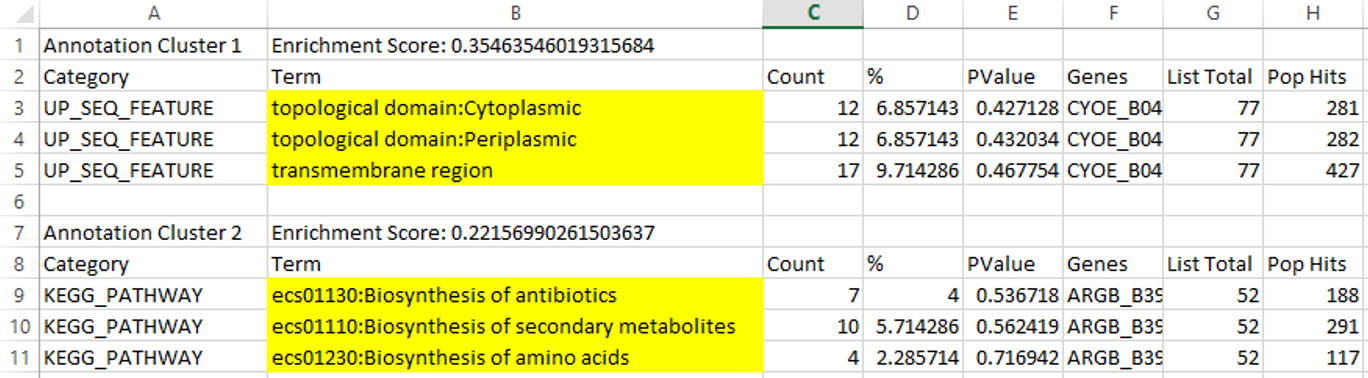
We can tell from the fuzzy clustering results, the top regulating genes fall into the categories of cytoplasmid, periplasmic, transmembrane, and biosynthesis of antibiotics, secondary metabolites, as well as amino acids (highlighted), which makes sense because these data are collected during biofilm formation in the first 24 hours of the culture.
Take-home Message
Using GENIE3 framework, we successfully found the top 100 gene regulating interaction in the network formed by 4631 gene expression over 24 h, based on the ranking given by random forests. A fuzzy clustering has been conducted to find out the main function categories of these top regulating genes. It took 30 min to run on my laptop.
Similarly, you can use GENIE3 framework to inference the gene regulatory network with your own data sets, and find out the categories of top regulating genes with DAVID tool. It might take some trial and errors to get it properly set up. But overall it is a very convenient tool. Good luck!
References:
- Environ Microbiol. 2009 January ; 11(1): 1-15. doi:10.1111/j.1462-2920.2008.01768.x.