RNA-Seq Mapping
In Genomic data analysis, new algorithms are coming out every day. We often hear about new topics on mapping algorithms such as TopHat, Cufflink, FASTAQ, and so on. However, for researchers, the problem is where to access these new algorithms and how to process their own datasets with them conveniently.
Now you have a shortcut in a software suite called GALAXY!
In this blog, I will walk you through GALAXY to analyze five RNA-Seq datasets.
Overview
The GALAXY Project is an open, web-based platform for data intensive biomedical research. Whether on the free public server or your own instance, you can perform, reproduce, and share complete analyses. It is supported in part by NHGRI, NSF, the Huck Institutes of the Life Sciences, the Institute for CyberScience at Penn State, and Johns Hopkins University.
Datasets
Here we analysis the differentially expressed genes in brain cells and adrenal cells. The datasets are paired-end 50bp FASTQ Sanger reads from adrenal and brain tissues (500Kb region of chromosome 19, chr19:3000000:3500000). These pair-ended sequencing data contains 4 Sanger reads file in total in FASTQ format, one forward reads and one reverse reads for each tissue. Each reads file contains around 50,000 short reads. You can download the datasets here: https://usegalaxy.org/u/jeremy/p/galaxy-rna-seq-analysis-exercise. But it is recommended to import it to your own GALAXY account directly.
Layout
Once you are in the mainpage, a list of operations/algorithms are shown in the leftmost panel called tools. Once you click on any operation, it will pop up a setting windows. Once it is done, this operation will show up on the rightmost panel called History.
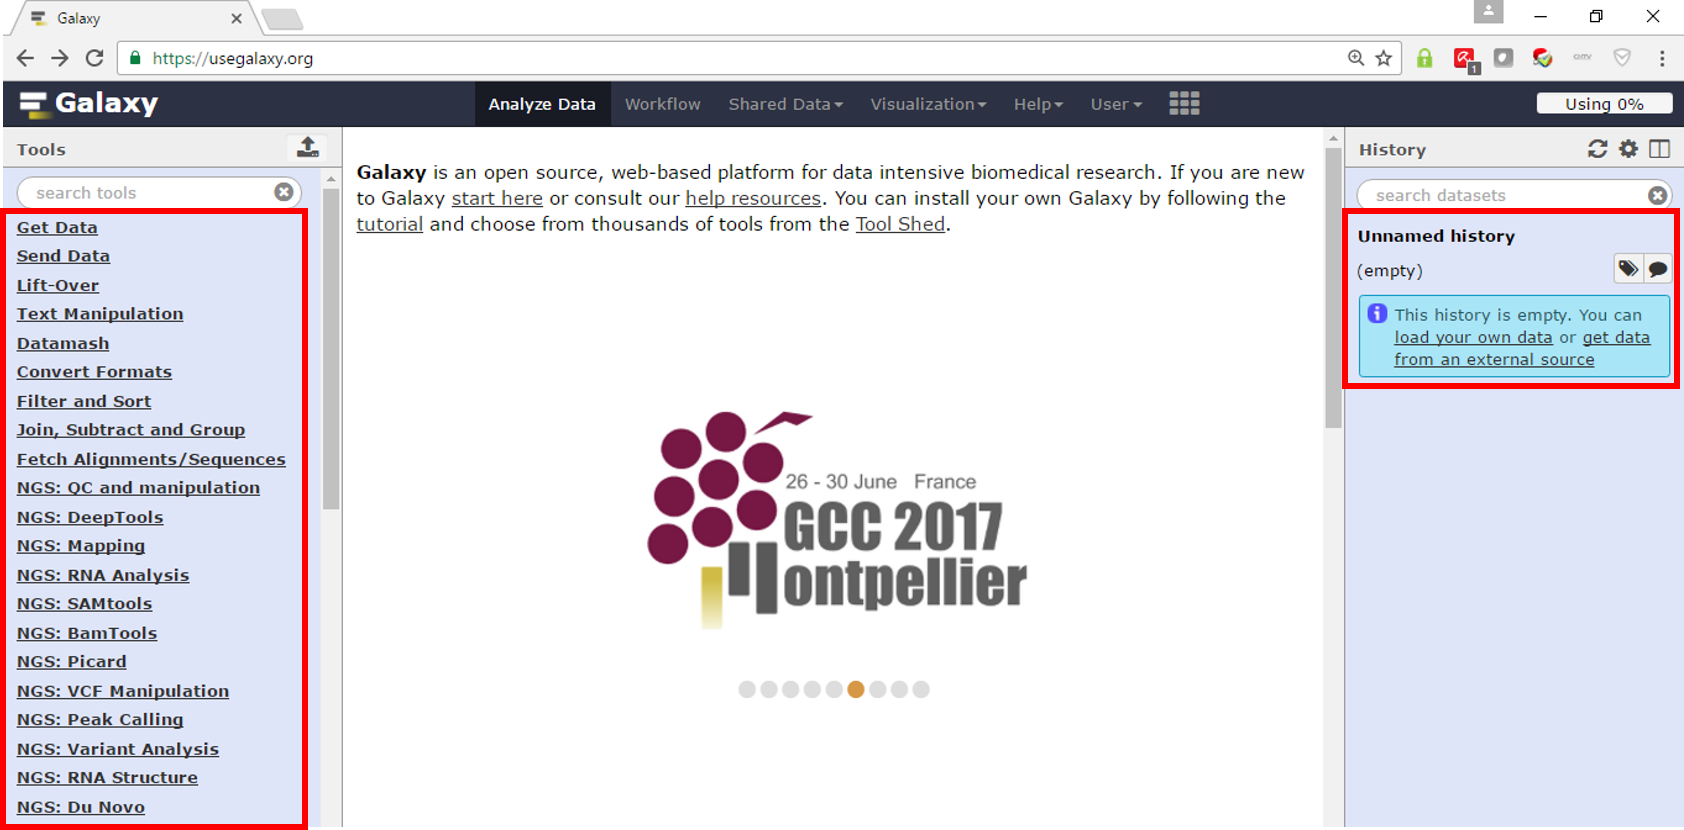
Then we can start importing data and perform our own RNA-Seq gene differential expression analysis.
Here is a link to my workflow.
Loading data and QC
The first thing we want to do here is to load in the data. You can import the five RNA-Seq datasets here by clicking on the import History button. It will show up in your current history after a few minutes. As we are doing remote database operation in queue by using this website, most operations will be relatively slow.
Once data is loaded, you can click on the left tool panel, and do the operation as instructed.
After loading data, I did a FastQC for quality control check on the data. Actually no data needs trimming.
Sequence Mapping and Visualization
Then TopHat algorithm is performed on individual raw Illumina sequencing datasets, to align and map all the reads to transcripts according and figure out all splice junctions.
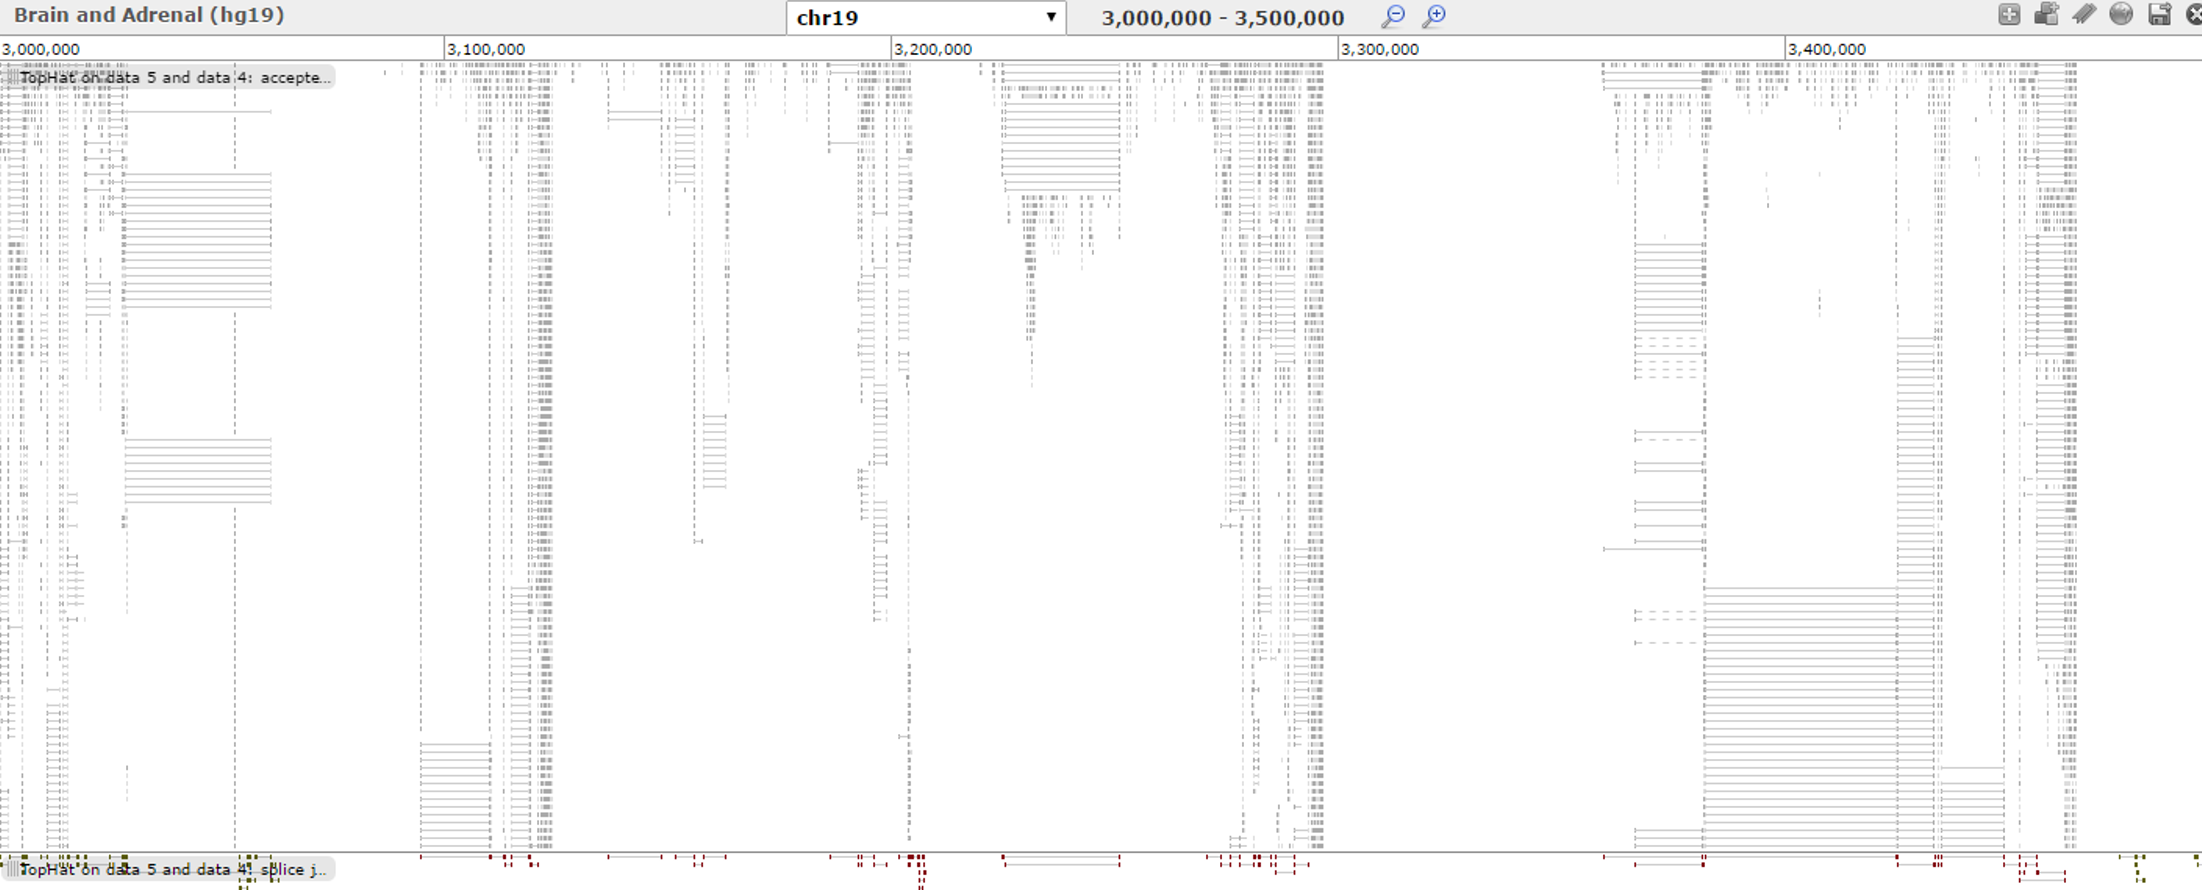
Here is a visualization of RNA-Seq mapping of brain tissue data sets. Visualization function is provided by the GALAXY website.
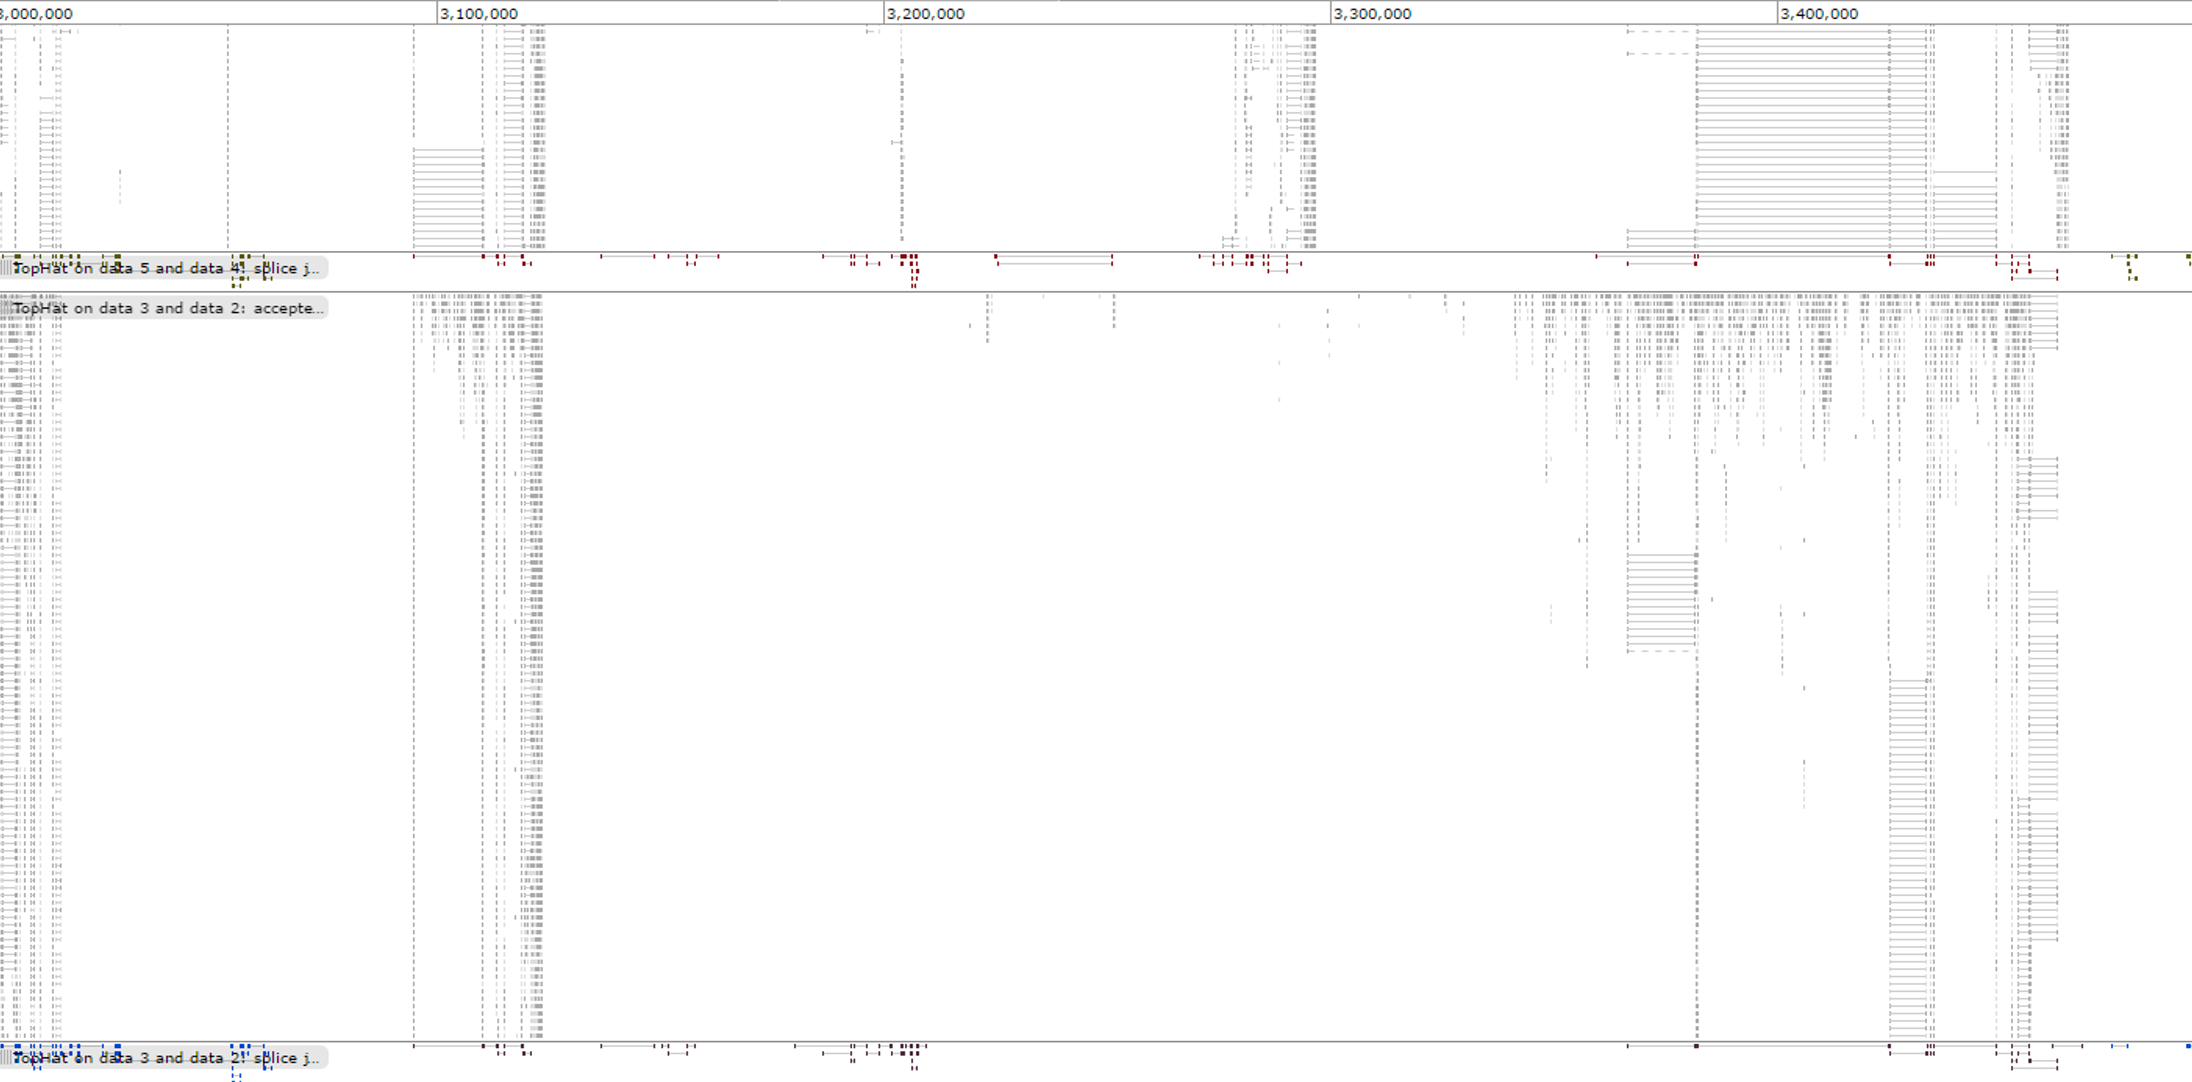
And the mapping of adrenal tissue data sets.
Gene Differential Expression Analysis
Cufflink is performed subsequently to analyze assemble differential gene expressions based on these assembled transcripts. Comparing with Genome annotation of hg19 on the top, we can have a intuitive understanding of the differentially expressed genes in brain and adrenal data sets.

Eventually, we can sort and filter on the top 100 DEG, to get novel transcripts of our interest for further study.
Download the Top 100 DEG here.
Have fun working with differential gene expression!